The
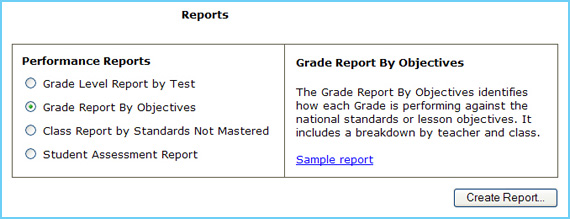
report allows you to identify how each grade is performing against the national standards or lesson objectives. It includes a breakdown by both teacher and class.
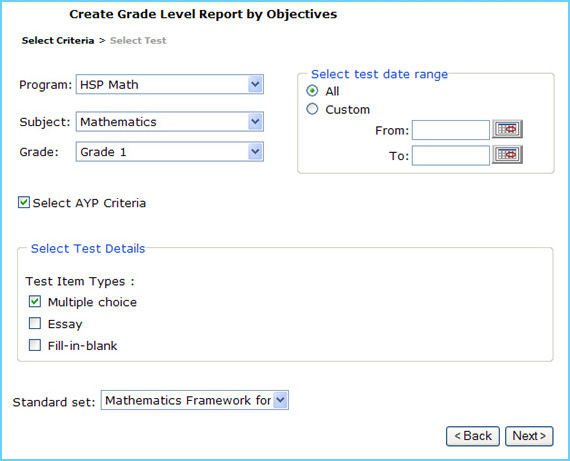
Select a test date range of either ‘All’ or ‘Custom.’ Note: Selecting ‘All’ will display all tests. Selecting ‘Custom’ will restrict the tests used for the report to a specific date range.
If ‘Custom’ is selected, enter in the ‘From’ and ‘To’ test date range, or select the calendar icon and select the desired test date range.
To filter your report by NCLB demographic categories, such as gender and English proficiency, by clicking on the Select AYP Criteria check box. (This field is optional.)
Select one or more question types to be included in the report in the Select Test Details section.
Select a standard set from the Standard set drop-down list.
To continue and select the tests for inclusion in the report, click Next.
To return to the previous page without generating a report, click Back.
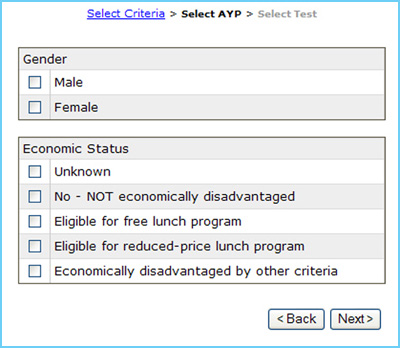
Select one or more attributes to filter the data displayed for the report. By selecting this data, only those students that match the selections you make will be included in the final report. (This step is optional.)
To continue and select the tests for inclusion in the report, click Next.
To return to the previous page without generating a report, click Back.
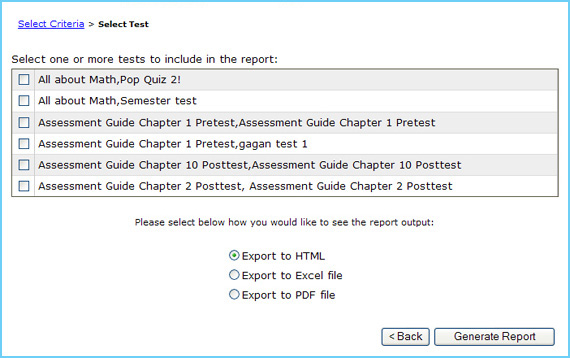
You must select at least one test to be included in the report. To select a test, click the appropriate checkbox next to the test name. Note: Tests that are currently "in progress" are not included on the list of available tests.
Select the report output type. You may generate the report as an HTML page, an Excel file, or as a PDF file.
To create the report, click Generate Report.
To return to the previous page without generating a report, click Back.